
 Facebook
 Twitter
 Pinterest
 Copy Link


Q2 was a story of resilience for the Seattle market. It began with our region fully entrenched in a new normal amidst the COVID-19 pandemic, but ended with a strong seller’s market and historic low interest rates. Buyers have returned in droves to battle for the limited supply of homes for sale. With a shortage of listings due both to economic/health concerns and sellers who can’t find anywhere to go, we could double our current supply of homes for sale and still fall short of demand.
Our region’s typical peak season was delayed with April feeling more like February and picking up momentum through the end of June. Possibly motivated as much by the changing home requirements of our newly revised lifestyles as it is by the opportunity to snag a coveted mortgage interest rate (a 1% change in interest rate equates to a 10% change in buying power), buyers are eager to find a place to call home.
Residential home prices are generally up throughout the region in Q2 while condominium prices are mixed depending on the building amenities and how well they have addressed COVID-19 concerns.
Click or scroll down to find your area report:
Seattle | Eastside | Mercer Island | Condos | Waterfront
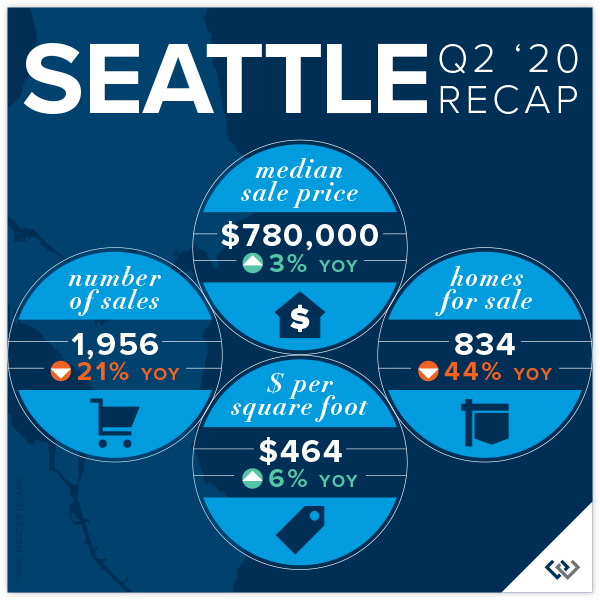
SEATTLE
Seattle’s median sale price increased by 3% in Q2 to $780,000. Queen Anne-Magnolia (+8%) and South Seattle (+7%) were top performers in the Seattle region while the Richmond Beach-Shoreline area was down 1% compared to Q2 2019.
68% of Seattle homes (all price points) sold at or above their listed price, while only 15% of homes priced above $1 million did so. The average number of days to sell decreased to 20 from 27 in Q2 of the year prior. There were 21% fewer Seattle home sales in Q2 2020 (1,956) compared to Q2 2019 (2,479) due to a shortage of homes for sale.
The highest Seattle home sale was a 2008-built Laurelhurst (North Seattle) waterfront home for $10,500,000 and the lowest was a 1979-built 1-bedroom approved floating home in a leased slip on Lake Union for $134,000..
Click here for the full report and neighborhood-by-neighborhood statistics!

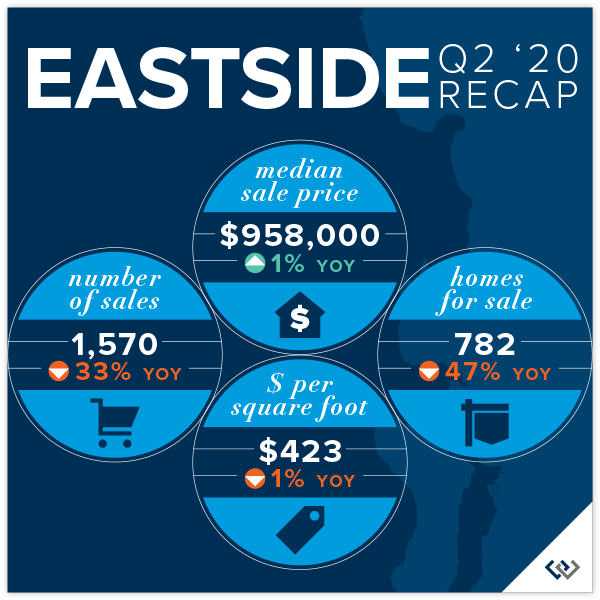
EASTSIDE
The Eastside median sale price was $958,000 in Q2, up 1% over Q2 2019. West Bellevue (+10%) and East Bellevue (+8%) performed best, while Mercer Island saw an 11% decrease in its median sale price with fewer luxury sales.
65% of Eastside homes, and 26% of homes priced above one million dollars, sold for at or above their listed price. The average number of days to sell decreased to 24 from 36 in Q2 of the year prior. There were 33% fewer Eastside home sales in Q2 2020 (1,570) compared to Q2 2019 (2,334) due to fewer homes available for sale.
The highest sale was a $11.75 million 2004-built Evergreen Point shared waterfront home on just over an acre and the lowest sale was a 1924 Skykomish cabin on Old Cascade Hwy.
Click here for the full report and neighborhood-by-neighborhood statistics!

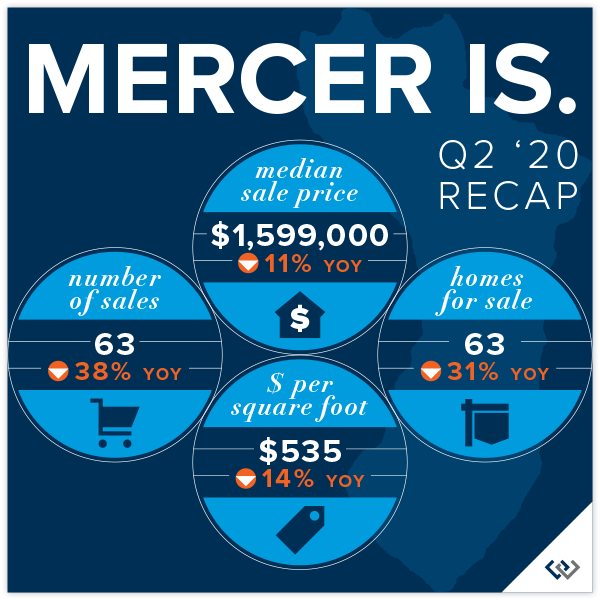
MERCER ISLAND
There was not a single Mercer Island home sale below $1 M in Q2. The bulk of Island sales were in the $1.2 M to $2 M price point (40 of 63 sales) and there were only four sales above $3 M.
The Island’s record shortage of homes for sale in Q2 continues to create a bottleneck of buyer activity with multiple offers common in the $1.2 M to $2 M segment of the market. Buyers are winning the competition by pre-inspecting and waiving typical contingencies more so that drastically escalating offer prices.
52% of all homes, and 8% of homes priced above two million dollars, sold for at or above their listed price. The highest Mercer Island sale was a $4.185 million, 2002-built Eastside waterfront home. Two “as-is” mid-island homes tied for the lowest sale of at $1,000,000.
Click here for the full report and neighborhood-by-neighborhood statistics!
CONDOS – SEATTLE & EASTSIDE
Condo sales have been more impacted by COVID-19 concerns than most residential homes. Condo buildings with individual outside access and those with stellar cleanliness policies tended to be more desirable than buildings that did not clearly address exposure concerns.
The Seattle median condo sale price was down 6% to $455,000 in Q2 as compared to Q2 2019 ($483,500). There were only 468 sales for the quarter vs. 764 sales in the same quarter last year. Downtown-Belltown condos (+6%) outperformed the region while Richmond Beach & Shoreline condos were down 20% over Q2 of the prior year (fewer higher end sales). 55% of Seattle condos (all prices), and 4% of condos priced above one million dollars, sold for at or above their listed price.
On the Eastside, the median sale price was up 9% to $525,000 (from $460,000 in Q2 2019). East Bellevue (+21%) and Redmond (+19%) condos far outpaced gains seen in surrounding cities. A total of 440 units sold on the Eastside this quarter. 65% of all Eastside condos, and 6% of those priced above one million dollars, sold for at or above their listed price.
Check out all of these factoids and more in the full condo report.
WATERFRONT
Sales of waterfront homes in Q2 with exclusive (not shared) access to the water picked up some momentum after a sleepy Q1 but remain far below typical norms. Seattle had 12 private waterfront home sales while Mercer Island and Lake Sammamish each had 5 sales and the Eastside had 4 sales.
Six (23%) of the 26 total sales closed at higher than their listing price, including one West of Market sale that went for $2 M above its listed price. Three sales (12%) closed right at their listed price and 17 (65%) closed below their listed price. Homes sold above their listed price sold in an average of 27 days for 11% higher than list. Homes sold below their listed price sold in an average of 125 days for 6% less than their listed price.
The highest Q2 private waterfront sale was in Laurelhurst at $10.5 million with 145 feet of Lake Washington waterfront. The most affordable was a $1.6 million West Lake Sammamish home with 50 feet of waterfront on the lake.
This top-level overview of the entire Seattle-Eastside private waterfront market, including Mercer Island and Lake Sammamish, provides a glance into the trends occurring in our region over time. Interesting, and certainly insightful, it in no way replaces an in-depth analysis on waterfront value provided by a savvy broker with years of local waterfront experience.

Find a Home | Sell Your Home | Property Research
Neighborhoods | Market Reports | Our Team
We earn the trust and loyalty of our brokers and clients by doing real estate exceptionally well. The leader in our market, we deliver client-focused service in an authentic, collaborative and transparent manner and with the unmatched knowledge and expertise that comes from decades of experience.
2737 77th Ave SE, Mercer Island, WA 98040 | (206) 232-0446 mercerisland@windermere.com
© Copyright 2020, Windermere Real Estate/Mercer Island. Information and statistics derived from Northwest Multiple Listing Service and deemed accurate but not guaranteed.
